Markets pages
The sector heatmap, ranked leaderboards, the earnings radar and a market-timing read.
Free
Top-down views of the whole market. All of them are free.
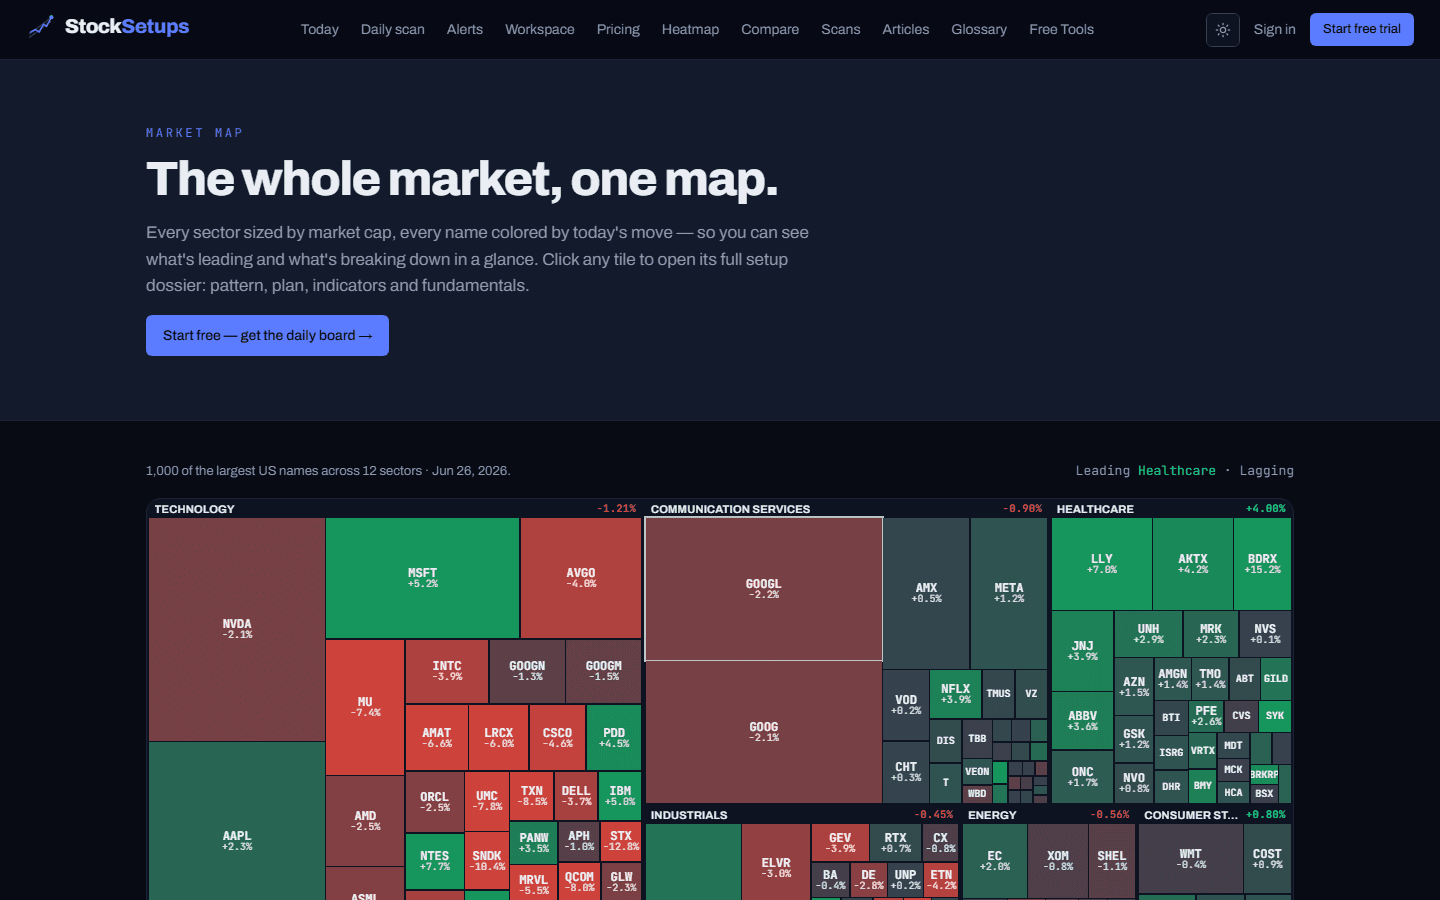
- Heatmap
- A Finviz-style sector treemap of the whole market, colored by today's move during the regular session (live on Pro, 15 minutes delayed on free) — click a sector (or its chip above the map) to maximize it with every stock in it and that sector's top gainers and losers; Back to all sectors (or Esc) returns. Click a tile to open that symbol. Tiles are sized by market cap and colored by the day's % move (saturating at ±5%); the map shows each sector's largest stocks.
- Leaderboards
- Ranked score boards (RS Rating, technical rank, momentum, volume, squeeze, analyst upside) with free and Pro tabs. Each board opens in rank order; sort another column for the visit and use Back to ranking to return.
- Earnings
- Upcoming reports across the US market. Inside the dashboard, switch between a sortable List and a Week or Month calendar: each day lists the biggest companies reporting with a BMO (before market open) or AMC (after market close) badge — TBA means the time isn't announced. Click anywhere in a day's box (or its weekday header) to load all of that day's reports underneath; click a ticker to chart it too. Reaction is the move on the first session after the report. Source: the Nasdaq earnings calendar (Zacks); projected dates often move.
- Calendar
- Inside the dashboard: Fed decisions and minutes, CPI / PPI / PCE, the jobs report and weekly jobless claims, GDP, the ISM surveys, options and index-futures expiration (plus the quarterly futures roll) and exchange holidays. View it as a one-line-per-event List grouped by week, or as a Week or Month calendar; hover an event for why it matters. Eastern release times; dates come from the Federal Reserve (FOMC), the Bureau of Labor Statistics (CPI, PPI, jobs, JOLTS), the Bureau of Economic Analysis (GDP, PCE) and the NYSE holiday calendar. GDP and PCE dates are published a year at a time; jobless claims, FOMC minutes, ISM surveys, expirations and the futures roll follow their publishers' standing rules. Dates are planned, not guaranteed.
- Market timing
- A free read on the broad-market trend — an IBD-style market-timing call.
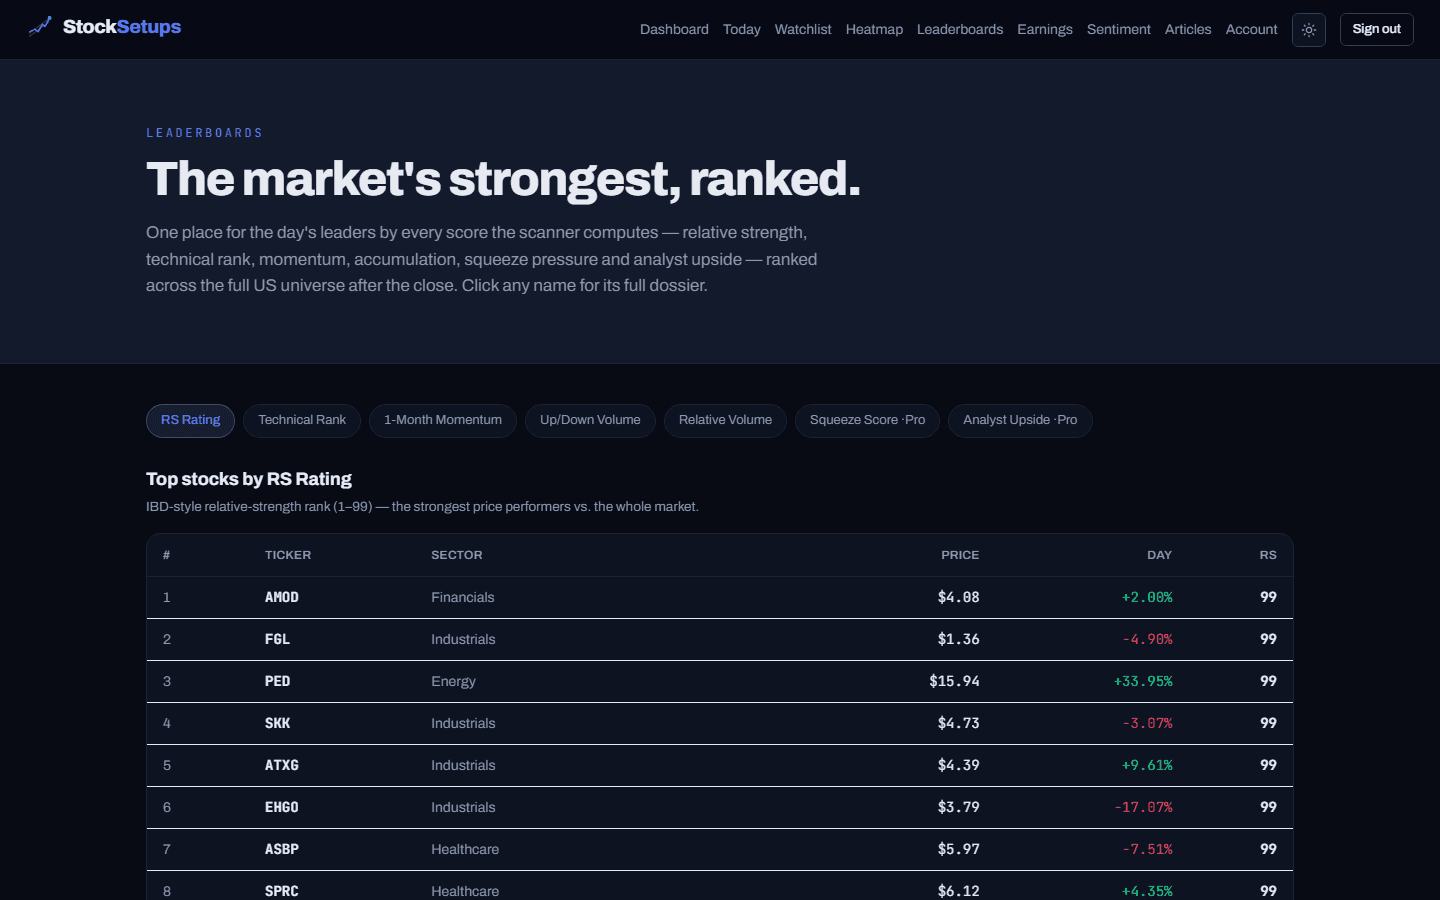
Leaderboards: Strength
- RS Rating
- IBD-style relative-strength rank (1–99) — the strongest price performers vs. the whole market.
- Technical Rank
- SCTR-style composite technical strength percentile across the universe.
- Up/Down Volume
- Accumulation proxy — up-day volume vs. down-day volume over the last 50 sessions.
Leaderboards: Day trading
- Top Gainers Today
- Best one-day price returns across the universe.
- Top Losers Today
- Worst one-day price returns across the universe.
- Relative Volume
- Today's volume vs. the 20-day average — where the unusual activity is.
- Top Volume
- Most actively traded by dollar volume — today's live leaders for Pro during the session, else the 20-day average.
- Biggest Gaps Up
- Largest opening gaps above the prior close.
- Biggest Gaps Down
- Largest opening gaps below the prior close.
- Most Volatile
- Widest average daily range (14-day ATR as a % of price) — where the intraday movement is.
Leaderboards: Swing
- Top Gainers · Week
- Best one-week price returns across the universe.
- Top Losers · Week
- Worst one-week price returns across the universe.
- Top Gainers · Month
- Best one-month price returns across the universe.
- Top Losers · Month
- Worst one-month price returns across the universe.
- Top Gainers · 3 Months
- Best three-month price returns across the universe.
- Nearest 52-Week High
- Closest to a 52-week high — leaders pressing into new-high ground.
- Squeeze Score (Pro)
- Short-squeeze composite (short interest, float, days-to-cover, short volume).
Leaderboards: Long term
- Top Gainers · 6 Months
- Best six-month price returns across the universe.
- Top Gainers · YTD
- Best year-to-date price returns across the universe.
- Top Gainers · Year
- Best one-year price returns across the universe.
- Top Losers · Year
- Worst one-year price returns across the universe.
- Top Earnings Beats (Pro)
- Biggest EPS beats vs. consensus among companies that reported in the last 45 days.
- Earnings Growth (Pro)
- Fastest year-over-year earnings growth.
- Revenue Growth (Pro)
- Fastest year-over-year revenue growth.
- Dividend Yield (Pro)
- Highest trailing dividend yields.
- Analyst Upside (Pro)
- Distance to the mean Wall-Street price target — the biggest implied upside.
There are more free, no-signup tools beyond Markets: a plain-English glossary, in-depth articles, trader calculators and head-to-head comparisons.
Related
Keep exploring
Trading glossaryPlain-English definitions of every pattern, candlestick, indicator and term.Candlestick patternsEvery candle the scanner flags — what it means and how often it actually worked.Free trading toolsPosition size, risk/reward, pivots and Fibonacci — no signup.Articles & guidesDeeper write-ups on setups, indicators and trading the scan.FAQHow the two engines, the data and the plans actually work.ComparisonsHow StockSetups stacks up against the scanners you know.Live scan hubsSee today's setups for each pattern, updated after every close.