Daily Patterns & Daily Candlesticks
Tonight's chart setups in four lanes, and tonight's candlestick signals split bullish / bearish.
Free & Pro
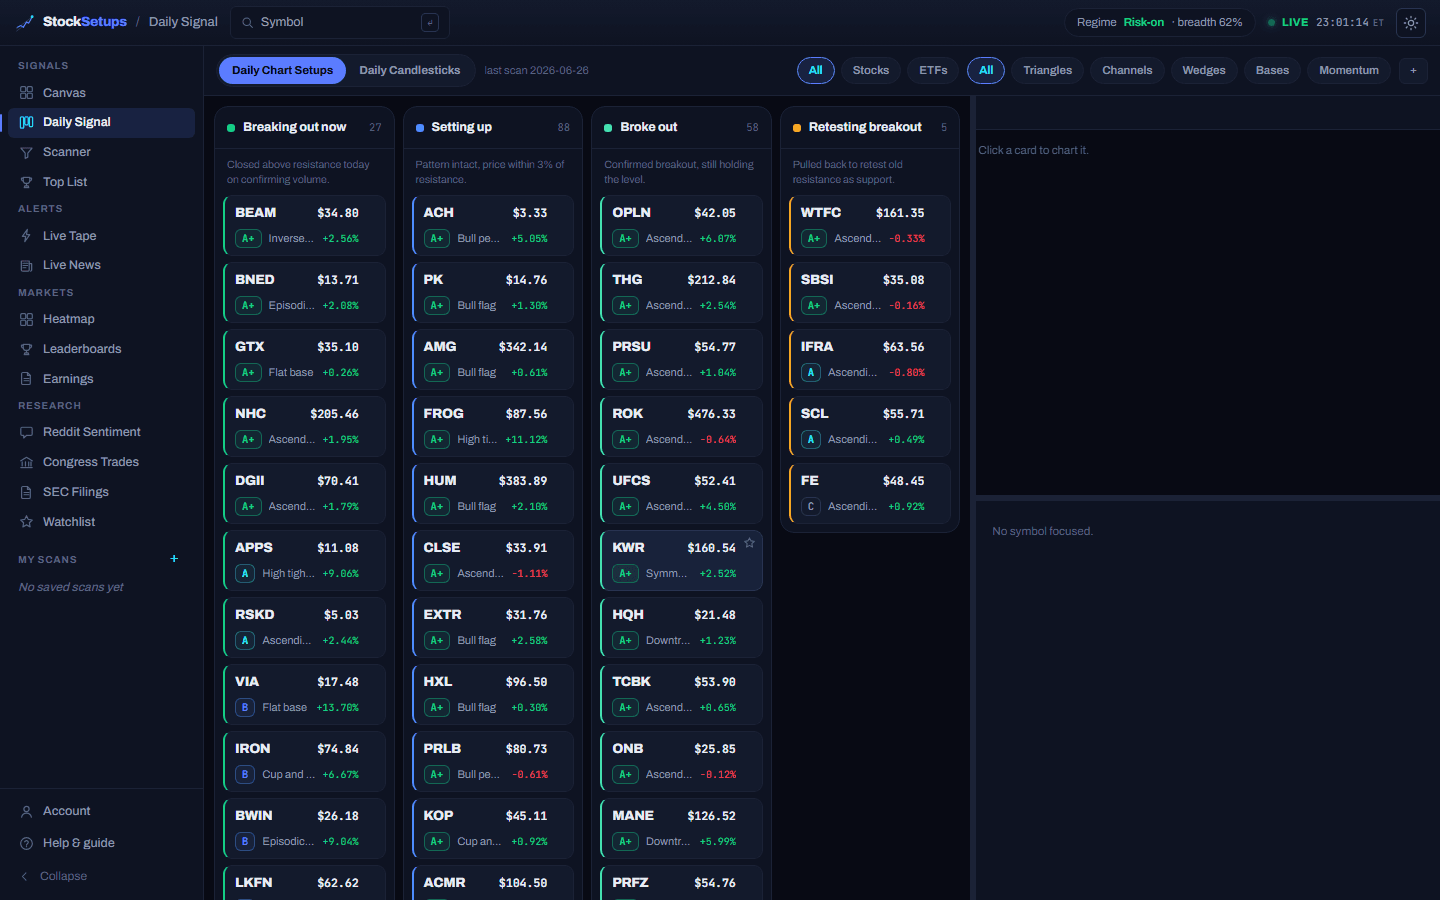
The nightly read, on two pages. Daily Patterns sorts every long chart-pattern setup into one of four lanes by where it sits in a breakout's life-cycle — Setting up → Breaking out → Broke out → Retesting breakout. Daily Candlesticks lists the day's candlestick signals, split Bullish / Bearish. Click any card to load its chart and fundamentals in the detail panel on the right.
The lanes
- Setting up
- Pattern intact, price within 3% of resistance.
- Breaking out
- Closed above resistance today on confirming volume.
- Broke out
- Confirmed breakout, still holding the level.
- Retesting breakout
- Pulled back to retest old resistance as support.
- Live breakout (Pro)
- A setup whose 1-minute close crossed its breakout line during the session, stamped with the minute, with the line and price vs the line now. It empties when the next scan publishes.
- On watch
- A cross in premarket or after hours that the regular session hasn't confirmed yet.
- Live breakout bell (Pro)
- Alerts on every new cross: bell and popup, an optional email (one per batch of crosses), optional premarket / after-hours watches, and a beep or spoken-ticker sound. Push follows Settings → Notifications.
- Risk-off note
- Shown when the market regime is risk-off, with breadth %. Breakouts fail more often in a weak tape; the link opens Market timing.
- Sort chip
- Rank · R:R · % to entry · Day % · $Vol (candles: Rank · Day % · $Vol). It reorders within each lane, after the free top-3 cut.
Controls
- Asset class chip (Pro)
- All · Stocks · ETFs. Narrows the board by asset class; your choice is remembered. The free board always shows every class.
- Pattern filter (Daily Patterns)
- Show only one pattern family (Triangles, Channels, Wedges, Bases or Momentum) or All.
- Type filter (Daily Candlesticks)
- Each lane's header has its own checklist of the candlestick types on it (hammer, engulfing, …), with counts — untick a type to hide it from that lane.
- ★ Star
- Add the symbol to your watchlist (20 symbols on Free, unlimited on Pro).
- Bell
- One-click price alert at the card's breakout level (3 active on Free, unlimited on Pro). The trade plan under the chart offers the same for the stop and the target.
- Right-click
- Opens the symbol menu — dossier, watchlist, portfolio, price alert. See Finding your way around.
- + Add stats
- Append per-symbol stats (RSI, volume, RVol, …) as a compact strip on each card.
- Arrow keys
- Walk through cards with the arrow keys; the detail panel follows the highlighted symbol.
- Drag the splitters
- Resize the lanes vs the chart, and the chart vs the fundamentals below it. Sizes persist.
The detail panel
- Trade plan (Daily Patterns)
- Entry, stop, target and reward:risk for the setup, with one-click alerts at each level.
- Historical edge
- How past signals like this one did 1 week, 2 weeks and 1 month later — the average return, how often they worked, and the sample size. On Daily Patterns it covers the pattern and the lane; on Daily Candlesticks, every candle of that type over the last 150 days (a bearish candle counts as working when price falls). A base rate, not a forecast.
- Candle signal (Daily Candlesticks)
- What the candle is, what it says and the day it fired. A candle carries no trade plan — treat it as a cue and wait for the next session to confirm it.
- Recent candles
- The symbol's last 5 candlestick signals and the 1-week move after each (✓ went the candle's way, ✗ didn't) — so you can see what has been working on this name lately.
On the chart
- Candle callout (Daily Candlesticks)
- The current candle is boxed and labelled with its pattern and an arrow — from above for a bullish candle, from below for a bearish one.
- Past candles
- Opt-in under Show: also boxes the symbol's last 5 earlier candlestick signals, each with ✓ if the week after went the candle's way and ✗ if it didn't.
- Past breakouts
- Opt-in under Show: the last few 50-day-high breakouts on the name, each labelled with its return 1 week (1W) and 1 month (1M) after the breakout close — whether the breakout kept working.
Candlestick meanings: bullish
- Morning star
- A big down candle, a small-bodied star, then an up candle closing past the first one's midpoint — sellers losing grip.
- Three white soldiers
- Three rising up candles, each opening inside the prior body and closing higher — steady buying.
- Bullish engulfing
- An up candle whose body covers the prior down candle's body — buyers overpowered sellers in one session.
- Piercing line
- Opened below the prior low, then closed back above the midpoint of the prior down candle.
- Hammer
- After a decline: a small body at the top of the range and a long lower shadow — sellers pushed it down and failed.
- Inverted hammer
- After a decline: a small body at the bottom of the range and a long upper shadow — buyers probed higher.
- Bullish harami
- A small up body inside the prior, larger down body — selling momentum stalled.
- Bullish marubozu
- A full-range up candle with almost no shadows — buyers in control from open to close.
- Three inside up
- A long down candle, a small up candle inside it, then a close above the first one's open.
- Three outside up
- A down candle engulfed by an up candle, then a higher close — the engulfing confirmed.
- Tweezer bottom
- A down then an up candle sharing a near-identical low — the low held twice.
- Bullish kicker
- A strong up candle that opened above the prior strong down candle's open — no body overlap.
- Dragonfly doji
- Opened and closed at the top with a long lower shadow — demand stepped in off the lows.
- Rising three methods
- A long up candle, three small bars inside its range, then a close above it — continuation.
- Mat hold
- A long up candle, a gap up and a shallow hold in its upper half, then a close above its high.
- Bullish belt hold
- Opened at the low and closed strong — a long up body with no lower shadow.
Candlestick meanings: bearish
- Evening star
- A big up candle, a small-bodied star, then a down candle closing past the first one's midpoint — buyers losing grip.
- Three black crows
- Three falling down candles, each opening inside the prior body and closing lower — steady selling.
- Bearish engulfing
- A down candle whose body covers the prior up candle's body — sellers overpowered buyers in one session.
- Dark cloud cover
- Opened above the prior high, then closed below the midpoint of the prior up candle.
- Hanging man
- Hammer shape after an advance — a long lower shadow shows sellers stepping in.
- Shooting star
- Small body at the bottom of the range with a long upper shadow after an advance — the rally was rejected.
- Bearish harami
- A small down body inside the prior, larger up body — buying momentum stalled.
- Bearish marubozu
- A full-range down candle with almost no shadows — sellers in control from open to close.
- Three inside down
- A long up candle, a small down candle inside it, then a close below the first one's open.
- Three outside down
- An up candle engulfed by a down candle, then a lower close — the engulfing confirmed.
- Tweezer top
- An up then a down candle sharing a near-identical high — the high held twice.
- Bearish kicker
- A strong down candle that opened below the prior strong up candle's open — no body overlap.
- Gravestone doji
- Opened and closed at the bottom with a long upper shadow — supply capped the rally.
- Falling three methods
- A long down candle, three small bars inside its range, then a close below it — continuation.
- Bearish belt hold
- Opened at the high and closed weak — a long down body with no upper shadow.
Candlestick meanings: neutral
- Doji
- Open and close nearly equal — indecision.
- Long legged doji
- Open and close nearly equal with long shadows both ways — maximum indecision.
- Spinning top
- A small body with shadows on both sides — indecision.
- Inside bar
- The whole range sat inside the prior bar's range — compression.
- Outside bar
- The range took out both the prior bar's high and low — expansion.
Reading the colors
Lane color tells you the status of a chart-pattern setup. Candle chips are different — they show a bullish / bearish / neutral bias and are confirmations, not lanes, so they never carry a lane color. Conviction scores and A+/A/B/C/D grades summarize how clean each setup is.