UBS
Conviction 58FinancialsScan · Thu, Sep 24, 2026UBS Group AG (UBS) closed at $48.45 (+1.49%) on Sep 24, 2026. Its latest daily candle is a bullish engulfing. Price is below its 50-day and above its 200-day moving average. RSI(14) 31, RS Rating 67, -13.1% from its 52-week high, +2.9% year to date. Sector: Financials · Banks - Diversified.
Signal lifecycle
How this symbol has moved through the lanes across 60 scans — each scan is re-classified from that day's price, so gaps are days it dropped off the board entirely.
- Setting upAug 61 scan
- Breaking out nowAug 71 scan
- Broke outAug 101 scan
- Retesting breakoutAug 111 scan
- Setting upAug 12 – Aug 247 scans
- Breaking out nowAug 261 scan
Congress activity
Disclosed STOCK Act trades in UBS · 4 recent
| Member | Side | Amount | Traded | Filed | PTR |
|---|---|---|---|---|---|
 Alan Armstrong senate · R · OK · traded 2026-03-30 | Buy | $15K–$50K | 2026-03-30 | 2026-07-21 | |
 Bruce Westerman house · R · AR · traded 2025-04-21 | Sell | $1K–$15K | 2025-04-21 | 2025-05-12 | |
Bruce Westerman house · R · AR · traded 2025-03-03 | Buy | $1K–$15K | 2025-03-03 | 2025-04-16 | |
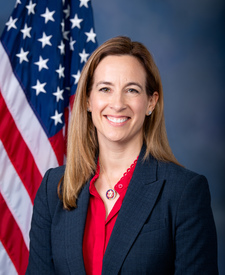 Mikie Sherrill house · NJ · traded 2025-03-07 | Sell | $250K–$500K | 2025-03-07 | 2025-03-10 |
Insider activity
SEC Form 4 transactions in UBS
SEC filings
EDGAR filings in UBS · 10 recent
- 8-K6-KFri, Aug 14, 2026
- 13F13F-HRThu, Aug 13, 2026
- 13D/GSCHEDULE 13GWed, Aug 5, 2026
- 13D/GSCHEDULE 13GWed, Aug 5, 2026
- 13D/GSCHEDULE 13GTue, Aug 4, 2026
- 13D/GSCHEDULE 13GTue, Aug 4, 2026
- 13D/GSCHEDULE 13G/AMon, Aug 3, 2026
- 13D/GSCHEDULE 13G/AMon, Aug 3, 2026
- 13D/GSCHEDULE 13G/AFri, Jul 31, 2026
- 13D/GSCHEDULE 13G/AFri, Jul 31, 2026
Get daily signals & real-time alerts.
StockSetups scans ~12,300 US stocks & ETFs after every close and sorts every long setup into four ranked lanes — each with a trade plan — plus an always-on engine firing 35+ real-time intraday alerts. Free for 14 days, cancel in one click.
Start free — 14-day full access →Educational data, not financial advice. Patterns, levels and the trade plan are algorithmic, not a recommendation to trade.